12 animated infographic examples and what makes them work
Twelve real animated infographics from NASA, NOAA, the FT, Bloomberg, the IMF, Kurzgesagt, Our World in Data and The Pudding, with the data story, technique and length of each.


I work at Moonb, and when a marketing team sends me a deck with a chart that needs three paragraphs of explanation, my first question is what movement would show that a still frame can’t. Most of the time the answer is change over time.
So when I say animated infographic I mean a chart, map or illustrated diagram that changes on screen while the viewer watches the data move in the order the storyteller picked.
The format has a famous ancestor. In December 2010 BBC Four aired The Joy of Stats, in which Hans Rosling told “the story of the world in 200 countries over 200 years using 120,000 numbers,” and did it “in just four minutes” (BBC).
1. NASA, “Climate Spiral: 1880-2022” (2023)
NASA’s Scientific Visualization Studio released this in January 2023: monthly global temperature anomalies from 1880 to 2022, measured against a 1951 to 1980 baseline and taken from the GISS Surface Temperature Analysis (GISTEMP v4). The SVS release page links the public data file behind it.
It’s a radial chart. Months sit around the rim like a clock face, a year counter ticks in the middle, and each year’s line winds outward, shifting from blue to red as the anomalies grow. Later the flat spiral tilts into a three-dimensional coil so the stacked years read as a tower. The SVS credits climate scientist Ed Hawkins with popularizing the spiral style in 2016.
The YouTube upload is 1:01, and the SVS page offers two more cuts of the same animation, 60 seconds at 30 fps and 30 seconds at 60 fps, which saves whoever cuts it for social a lot of work.
2. Financial Times, “Bar chart race: the most populous cities through time” (2019)
The oldest video here. I’m tired of bar chart races in general, most of the ones I see in decks are motion for its own sake, but this is still the clearest one I know. John Burn-Murdoch presents it over 3:13, following the race to be the world’s most populous city from 1500 to 2018, and the FT’s description says it shows “how the emerging markets have come to dominate.”
Bars are colored by world region, with a small corner map as the legend and a big year counter behind them. Watch the axis. Early on it’s marked in hundreds of thousands of people; by a late frame the labels run to 15,000 thousand, or 15 million. The bars keep moving while the scale underneath them stretches, and a viewer who misses that will misread the ranking. Burn-Murdoch also cuts in on camera, so the chart becomes a segment with a host.
3. Bloomberg News, “Different Time Frames Tell Very Different Inflation Stories” (2023)
A 1:08 short from February 2023 that makes one argument with one chart type. Economists usually measure inflation over the preceding 12 months, the description says, “but the picture can change radically if the look-back period is shortened.”
Line charts sit over darkened stock footage with captions underneath. One frame shows US CPI for 2021 and 2022 with two labels pinned to the line, +9.1% in June 2022 and +6.4% in December 2022. Another redraws core PCE inflation on its own axis, and a later caption points viewers to “the three-month inflation rate.” The on-screen credit gives the insight to Blu Putnam, chief economist at CME Group, which also presents the video.
Plenty of marketers treat the date range on a chart as a technical detail, picked because it looked nicest on the slide. The video spends its whole runtime showing how much the window changes the conclusion.
4. USAFacts, “What does the data show about increased tariff revenue?” (2025)
Two presenters at a desk on a branded magenta set, 1:28, and more than 19 million YouTube views since USAFacts published this Just the Facts short in December 2025. Halfway through, the data gets a white card laid over a photo of the Capitol, “Customs duties revenue, $195B, equals 2%,” with “Source: Department of the Treasury” printed underneath, and the thumbnail pairs one presenter with a line chart of customs revenue since 1980.
It’s also the easiest thing on this list to borrow for a product update or an earnings recap, where one figure deserves saying twice. The description fills in the context: in fiscal year 2025 the federal government collected “nearly $195 billion” in customs duties, “more than double the year before,” and that is still “a relatively small share of total federal revenue.”
5. IMF, “World Economic Outlook, October 2024”
Yellow shopping baskets, one labeled services and one labeled goods, each with a red or green disc on a stick above it. That’s how the IMF shows prices in a 1:44 summary of a forecast full of decimals. The description gives growth of 3.2% for 2024 and 2025, with inflation “dropping to 4.3% by 2025.” Later, green arrows line up across a faint world map under the line “For the global economy to emerge stronger and more resilient.”
Nobody walks away from a basket with a green disc able to quote 4.3%, and I doubt the IMF expects them to. The exact figures sit in the report the video points to.
6. Kurzgesagt, “South Korea is over” (2025)
At 14:47 this is the longest piece in the list by a wide margin, and Kurzgesagt tells its April 2025 demographic argument almost entirely through illustration. The two facts it hangs on are quoted in the description, which also links a public list of sources: South Korea has “the lowest fertility rate ever recorded,” and “by 2060, nearly half of South Koreans could be over the age of 65.”
In one scene a train with the Korail logo carries the channel’s bird characters; another shows an isometric city street full of buses and cars. Elsewhere two older craftspeople work, one sewing and one at a potter’s wheel. The statistics come in through the narration, over those scenes, and I think that’s why a fertility rate stuck with me here when it wouldn’t have on a slide.
Our breakdown of animated educational videos covers how Kurzgesagt handles scale in its science work; the population pieces here use the same tools.
7. American Museum of Natural History, “Human Population Through Time” (2023 update)
The museum updated this 6:19 video in 2023, and the data story fits in a line: it took most of human history for the population to reach 1 billion, and just over 200 years to reach 8 billion. The credits list the museum’s own writer, animator and scientific advisers, with population data from Population Connection, the UN World Population Prospects and the US Census Bureau.
At the quarter and halfway marks the argument is a dot-density map with a counter. The first of those frames reads “Year: AD 1” and “Human population: 170M,” and the key says one dot equals one million people. By the halfway mark the count is 398 million, and event markers have joined the timeline axis along the bottom. Later it switches to a line chart with a shaded “Projected” zone and the label “Leveling off,” plus a note that if fertility forecasts are slightly off, the peak will come lower or higher. Most projection charts that land in my inbox skip that caveat.
8. NOAA Climate.gov, “Early September Arctic sea ice age, 2000-2023” (2024)
All of it fits in 22 seconds. My favorite on the list, and the shortest.
Climate.gov built it from National Snow and Ice Data Center data for a story on what an “ice-free” Arctic means, where the caption reads: “This animation shows early September sea ice age, 2000-2023. Areas with old, thick sea ice (white) in recent years are likely the same areas where sea ice will persist in a warmer future” (NOAA Climate.gov).
The map never moves. The title “Canada’s Arctic islands are last refuge for old ice” stays put, a row of years from 2000 to 2023 runs across the top with a dot on the current frame, and a legend for ice age in years, from 0 to 5+, sits at the bottom.
9. NASA Goddard, “Model Behavior: Visualizing Global Carbon Dioxide” (2024)
Released in July 2024, this comes from GEOS, the Goddard Earth Observing System, a weather reanalysis model that “pulls in billions of data points from ground observations and satellite instruments” (NASA SVS). For 1:52 you watch carbon dioxide move through the atmosphere, plume by plume.
A globe turns from region to region with a timestamp. One frame has orange and red plumes streaming across North America; others turn to Africa, the corner timestamp reading February 2020. There are no axes. Whatever you learn comes through the narration and the colors, which is fine for a sense of scale and no help at all if a viewer needs a figure to quote back. The SVS page also lists a version “formatted for vertical social media platforms,” so the piece went out twice, once for YouTube and once for phones.
10. EUMETSAT, “A year of ocean temperature, 2024” (2025)
Next to the NASA globe, this one keeps far more reference marks on screen: a title tag, a running date (“2 January 2024,” then “26 April 2024”), a temperature legend from -1.8 to 34 degrees Celsius in the corner, subtitles along the bottom.
It’s 5:51 on a single variable, which is long. EUMETSAT published it in December 2025 to follow sea surface temperature across 2024 “using a combination of satellite observations and ocean surface measurements,” warmer water in red near the tropics, cooler water in blue toward the poles and sea ice in white. Because one color scale holds for the whole year, a viewer can compare January with August without being told to.
11. Our World in Data, “Child mortality rate” map
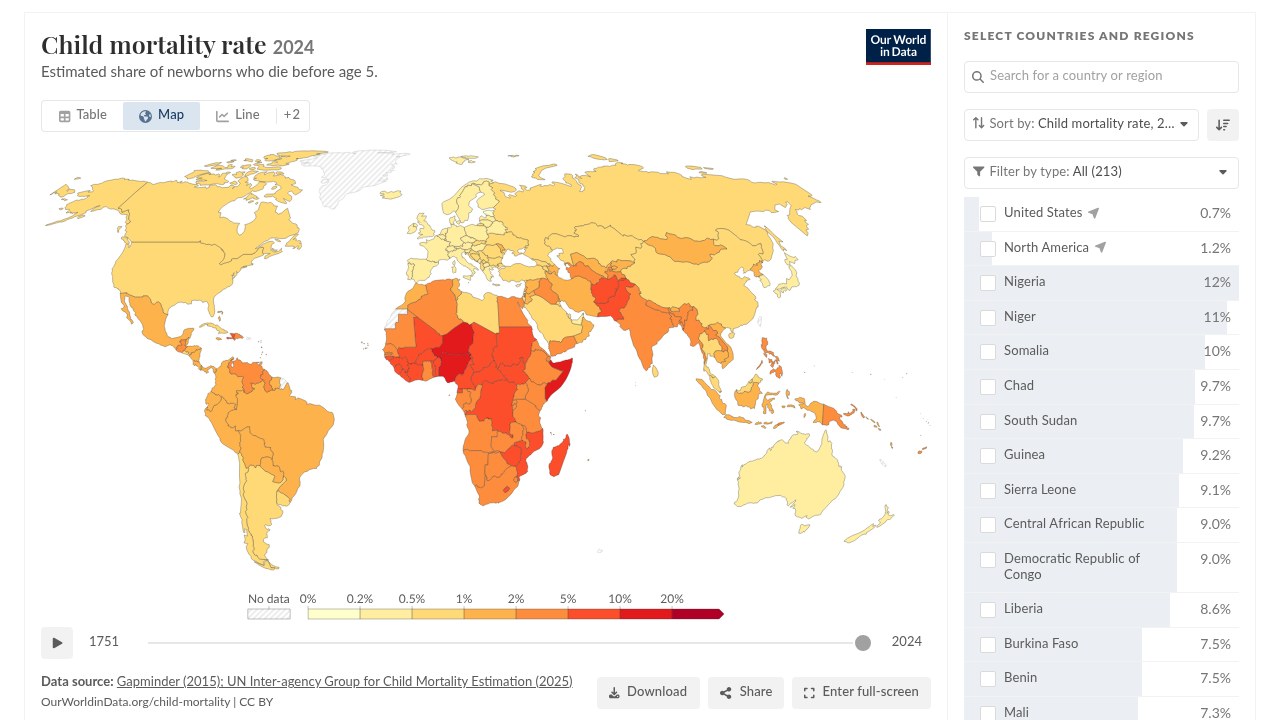
This is the odd one out, an interactive chart where the reader sets the pace, and in a report I like pairing it with a fixed video; skeptical readers can stop on any year and check the number. Our World in Data’s child mortality map shows the estimated share of newborns who die before age five, with data from Gapminder and the UN Inter-agency Group for Child Mortality Estimation. The page lists a date range of 1751 to 2024 and a last update in June 2026.
Under the map there’s a play button and a slider from 1751 to 2024. Press play and the countries change color year by year, or drag to one year and stay there. The legend runs from 0% to 20% in uneven bins (0.2%, 0.5%, 1%, 2%, 5%, 10%), a sortable country list sits on the right, and the source and CC BY license are printed under the chart.
 Source: Our World in Data, CC BY.
12. The Pudding, “Sizing chaos” (2026)
The Pudding’s Sizing chaos, by Amanda Sakuma with Jan Diehm, is a scroll-driven essay about women’s clothing sizes. Like the OWID map it has no fixed length, since nothing advances until you scroll. It starts with waistline measurements for US girls from the National Center for Health Statistics and follows them into adulthood. At 15 the median waist is 30.4 inches and the adult median is 37.7 inches, and the story finds that the median adult woman over 20 fits a size 18 while most standard size ranges stop at 16.
The opening screen pairs an illustrated tween with a headline in cut-out, ransom-note letters, then a “Scroll” cue. Further down, each ASTM size from 00 to 20 becomes a dot, with the size charts of 15 popular brands lined up beside it and shaded bands where a brand gives a range. Every scroll moves text and chart forward together, one comparison at a time.
 Source: The Pudding.
For more on moving type, our guide to kinetic typography covers how moving type carries a message.
How long each one runs, and what it uses
| Example | Publisher, year | Data story | Technique | Length |
|---|---|---|---|---|
| Climate Spiral: 1880-2022 | NASA, 2023 | Monthly temperature anomalies since 1880 | Radial chart that tilts into a 3D coil | 1:01 (plus 30 s cut) |
| Most populous cities through time | Financial Times, 2019 | Largest cities from 1500 to 2018 | Bar chart race with a rescaling axis | 3:13 |
| Different time frames, inflation | Bloomberg News, 2023 | 12-month vs shorter inflation windows | Line chart over footage, captions | 1:08 |
| Tariff revenue, Just the Facts | USAFacts, 2025 | FY2025 customs duties in context | Presenters plus big-number card | 1:28 |
| World Economic Outlook | IMF, 2024 | Growth and inflation forecast | Pictograms and icons | 1:44 |
| South Korea is over | Kurzgesagt, 2025 | Fertility and aging | Illustrated and isometric scenes | 14:47 |
| Human Population Through Time | AMNH, 2023 | Population from AD 1 to 8 billion | Dot-density map, counter, projection | 6:19 |
| Arctic sea ice age, 2000-2023 | NOAA Climate.gov, 2024 | Where old ice survives | Fixed map with timeline scrubber | 0:22 |
| Model Behavior, global CO2 | NASA Goddard, 2024 | CO2 moving through the atmosphere | Rotating globe from a model | 1:52 |
| A year of ocean temperature | EUMETSAT, 2025 | Sea surface temperature in 2024 | Narrated globe with date and legend | 5:51 |
| Child mortality rate | Our World in Data | Child deaths, 1751 to 2024 | Interactive map with play button | Viewer-controlled |
| Sizing chaos | The Pudding, 2026 | Clothing sizes vs real waistlines | Scrollytelling, cut-out type | Reader-paced |
NOAA, Bloomberg and USAFacts each make a single point, and none of them runs past a minute and a half. The pieces that run several minutes are building an argument, and AMNH even switches chart type partway through, from a dot map to a projection line. Most briefs I see carry one finding, so I’d start from the short end of the table. I’d only go long when there’s a real argument to build. Matching length to the job gets a fuller treatment in how long an explainer video should be.
Turning a static chart into motion without distorting the data
I always ask to see the still version first. When the units or scale already confuse people on paper, animating it hands them a second thing to decode.
The reference I keep going back to is “Animated Transitions in Statistical Data Graphics,” a 2007 paper by Jeffrey Heer and George Robertson (University of Washington). Two controlled experiments found that “animated transitions can significantly improve graphical perception,” and the design rules they drew from them make a decent checklist for a marketing team:
- Keep every in-between frame a valid chart as far as you can, because viewers read meaning into the in-between states too.
- Break a complex change into stages. The paper’s own example: “separating axis rescaling from value changes may help.”
- Keep paths simple. The paper cites perceptual research showing translation and expand or contract motions are easier to follow than rotation.
- Make transitions “as long as needed, but no longer.”
The FT race is a good test of the second rule. Its axis grows from hundreds of thousands to 15 million over the video, and the bars only stay truthful because the labels move with them; without that, a city that grew tenfold could look flat.

Elsewhere in the list, EUMETSAT holds one temperature legend for all of 2024. NOAA’s timeline dot never leaves the screen, and AMNH shades its “Projected” zone so nobody mistakes a forecast for data.
I’m more careful with probability. A 2024 commentary in the Journal of the American Medical Informatics Association, drawn from a large systematic review, concluded that “evidence is not yet strong that interactivity or animation is more effective than static graphics for communicating probabilities in health” (PMC). When the chart is about odds or risk, test a static version against the animated one before you commit to motion.
My last check before sign-off: show the finished piece to someone outside the project and ask which group changed most, by how much, and over which period. When someone needs a rewind to answer, I usually give the final frame a longer hold.
Production time and tooling
A 22-second map loop can sit on far more data work than its runtime suggests, while a templated chart race built from a tidy spreadsheet mostly costs the time it takes to check the numbers. When I estimate, I split the work four ways: data preparation (definitions, sources, missing values), story and storyboard, motion and audio, and review across every output size.
A study of 108 data-GIFs collected online found an average length of 11.87 seconds, with 78.7% of them under 15 seconds and 86.1% using exactly one chart type (Shu et al., arXiv), which matches the shortest entries above. Extra time tends to go into versions. The NASA spiral shipped as a 60-second and a 30-second cut, the CO2 globe as a horizontal and a vertical version, and both decisions belong at the storyboard stage. Our storyboard examples show how teams lay out frames before animation starts.
- Chart race or stepped explainer, no code: Flourish has a bar chart race template and a stories feature for multi-step explainers with charts and captions.
- A still you plan to animate later: this educational infographic generator, built for teachers, turns three to six facts you supply into a process, comparison, labeled diagram or fact layout. It says plainly that it does not research facts, so check every label before anything moves.
- To see how small an interactive explainer can be, try Unitism’s Value Map. You drop a station, park or school onto a grid city and watch land value rise around it as translucent 3D bars, with a running total of the value the amenities created.
- Custom scenes like the Kurzgesagt or IMF pieces put you in motion design software and illustration territory. Our overview of types of motion graphics maps those styles, and UI animation covers the scroll and interface side.

Who should build it depends mostly on whether it repeats. The same chart on a schedule, in a fixed template with clean data and someone who owns it, is well within reach of an in-house team. A one-off narrated piece with illustration, several chart types and multiple output sizes asks for animation and sound skills on top of design. Either way, whoever owns the data should approve the definitions and the final frame.
Frequently asked questions
A chart, map or illustrated diagram that moves on screen, so you watch the data change in the order the storyteller picked. It can be a short video clip, a looping GIF, an interactive chart with a play button, or a web story where each scroll step advances the comparison.
Usually short. A study of 108 data-GIFs found an average length of about 12 seconds, and most used a single chart type. One finding fits that scale, like NOAA's 22-second sea ice map, while the longest explainers in this list run from about six to fifteen minutes because they build a whole argument.
Keep every in-between frame a valid chart as far as you can, and change one thing at a time. Scale, units and the time marker should stay visible the whole way through. If the axis has to rescale, give that its own stage so viewers see it happen. Hold the final frame long enough to read, and shade or mark any projected values so nobody takes a forecast for measured data.